By Z. Aw | Published
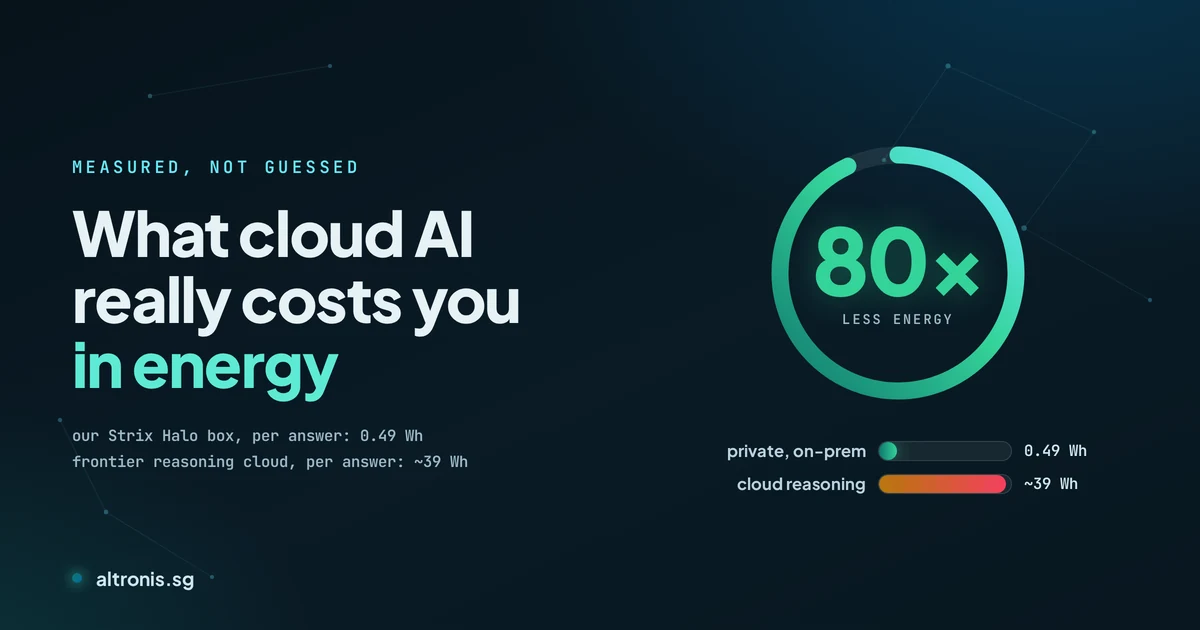
What cloud AI really costs you in energy
Cloud AI feels free until the energy bill and the carbon report arrive. The question we keep getting from Singapore teams looking at their first ESG disclosure is simple: does running AI on your own hardware actually use less energy than the cloud, or is that just a nice story?
So we measured it. The calculator below compares, per answer, what a right-sized private model on your own hardware draws against the cloud frontier models most teams reach for. Pick your setup, the cloud model you would otherwise use, and your team's volume. Every figure is either measured on our own AMD Strix Halo box or taken from a published source, and each one is labelled as such.
Every option, energy per answer
Log scale: each equal step of bar length is 10× the energy. One ~320-word answer.
How to read it
The honest headline is not on-prem versus cloud. A hyperscaler data centre is more efficient per watt than a box in an office. The saving comes from right-sizing: running a model sized to the task instead of sending every query to an oversized frontier model. On a short, simple query the gap is small. On the long documents and the reasoning work that businesses actually reach for frontier models to do, a right-sized private model uses a fraction of the energy.
The line worth staring at is the 2× DGX Spark option: a 284B frontier-class model, running on your own premises, at under 1 Wh per answer. That is a fraction of a cloud reasoning model, with none of your data leaving the building.
Cloud AI is an opaque Scope 3 in your value chain: hard to measure, impossible to control. Run the same workload on-prem and that energy becomes your own Scope 2, which you can measure and decarbonise with green power. It also maps directly to Singapore's new green-data-centre standard SS 715:2025, which shifts the metric from facility PUE to compute-per-watt.
References and fact-check
Every number in the calculator is traceable. Measured and estimated values are marked as such so nothing reads as invented.
Measured by Altronis. Strix Halo box: 0.11 Wh (Qwen 3.6) and 0.35 Wh (Glimmer 30B) per ~320-word answer, sampled at the AMD compute-package power sensor on 12 August 2026. The 0.15 and 0.49 Wh used in the tool are the whole-system estimate (about 1.4× for RAM, board and power supply; we do not yet have a wall meter).
Estimated or derived. GPT-5 at about 18.35 Wh per medium reply (5 to 40 Wh by length, about 8.6× GPT-4): University of Rhode Island AI lab estimate, not an OpenAI figure and not instrumented, reported by Tom's Hardware and Data Center Dynamics. 2× DGX Spark running DeepSeek V4 Flash at about 0.7 Wh: computed from roughly 380 W under load and about 50 tokens per second for a 320-token answer. We have not measured a DGX Spark ourselves. Renewable-matched cloud at about 0.125 kg CO2 per kWh: derived from Google's reported 0.24 Wh and 0.03 gCO2e per prompt.
From published sources. Frontier quick answer 0.42 Wh and long document 1.79 Wh (GPT-4o), and deep reasoning about 39 Wh (o3, with a wide error bar): How Hungry is AI? (arXiv:2505.09598). Reasoning 3.9 Wh and the 200B-model median 0.31 Wh: Energy use of AI inference, Joule 2026. Typical query about 0.3 Wh: Epoch AI. Google median prompt 0.24 Wh and 0.03 gCO2e: Google. Singapore grid 0.402 kg CO2 per kWh (2024): Energy Market Authority. US average grid about 0.37 kg CO2 per kWh: US EPA eGRID. Car about 0.25 kg CO2 per km: US EPA. DGX Spark 240 W system and 41 to 61 tokens per second for DeepSeek V4 Flash on two units: LMSYS and a dual-Spark benchmark.
On the model names: every cloud bar carries a published number, and the label says which kind. Measured means an instrumented study (GPT-4o, o3, the Joule reasoning workload). The GPT-5 bar is a third-party estimate: the University of Rhode Island AI lab puts a medium GPT-5 reply at about 18 Wh (5 Wh light, up to 40 Wh heavy), roughly eight times GPT-4, and OpenAI has not published its own figure. For the newest tier (GPT-5.5, Claude Fable 5, Claude Opus 5) there is no vendor data and no independent estimate at all, so they are not charted. The trend those estimates show is the point: energy per answer is going up with each frontier generation, not down.
Related reads
Last updated 12 August 2026.